
For any data scientist, representation of data becomes an important part in their daily life. Being able to see the WHAT/HOW/WHY of data gives more clear picture about the data.
For better understanding check out the following images, one where we are seeing out data in a dataframe and in the next image see the graphical representation of the same data

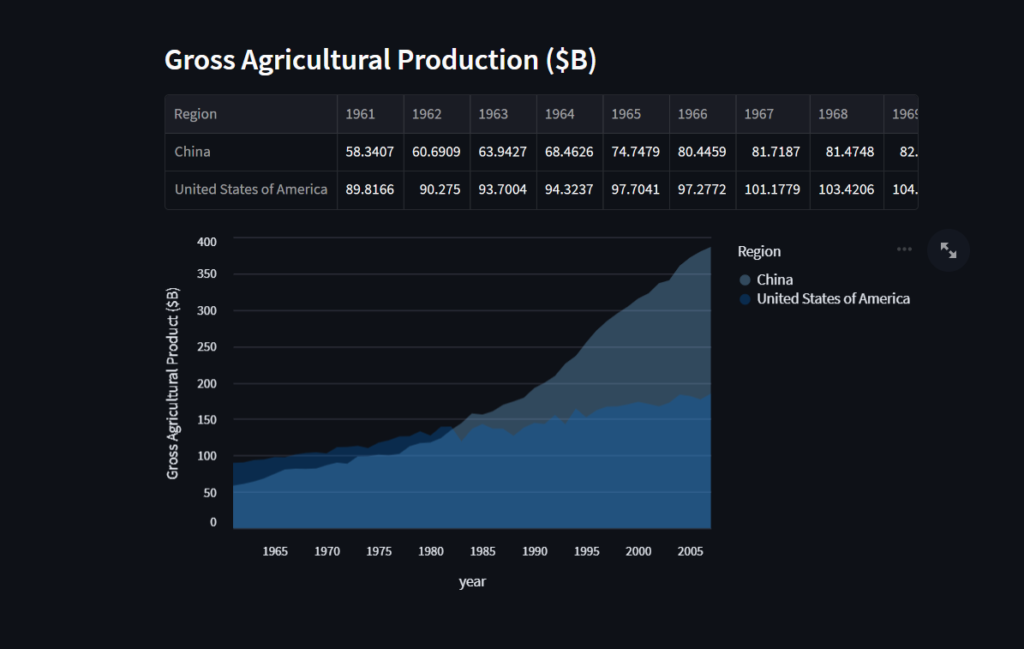
As you can see we can understand more about the data from our graphical representation rather than seeing in a dataframe.
We have google collab where we can use matplotlib to display our data graphically. But it has its limitations too.
- You will have to run it at your end to see the data
- It is not deployed anywhere, You will have to share your code for others to see the graphical representations.
One way to solve this is to deploy a webApp which contains both frontend and backend to handle our needs.
- frontend – To let user see data in graphical format for better understanding.
- backend – Processes and sends data to frontend.
But only to show the data in pictorial format we have to create an entire frontend application. That’s some extra work right ? Not to forget that many of the Backend devs/Data Scientists do not have strong hand in frontend domain, Which makes this task extra lengthy.
Well not worry, because Streamlit is here, which says
Streamlit allows you to code everything in python proframming language which is the go to language for any Data scientist. Which makes it super easy to learn and implement. The documentation provided by Streamlit is super clean and easy to getting started.
Keeping that in mind let’s try to create something with Streamlit in python
Prerequisites
- Streamlit library which can be installed using pip:
pip install streamlit
Coding Section
Once you have installed installed streamlit library, Create a file app.py and write the following code in it.
import streamlit as st
st.write("""
# Hello World from Streamlit
## Streamlit supports Markdown too
` This makes it so much good to use`
""")
Code language: Python (python)Save the file and to run it simply type: streamlit run app.py in your terminal. It will launch a server and we can check out our very first streamlit app in a browser. If everything worked correctly, You will see this in your browser.
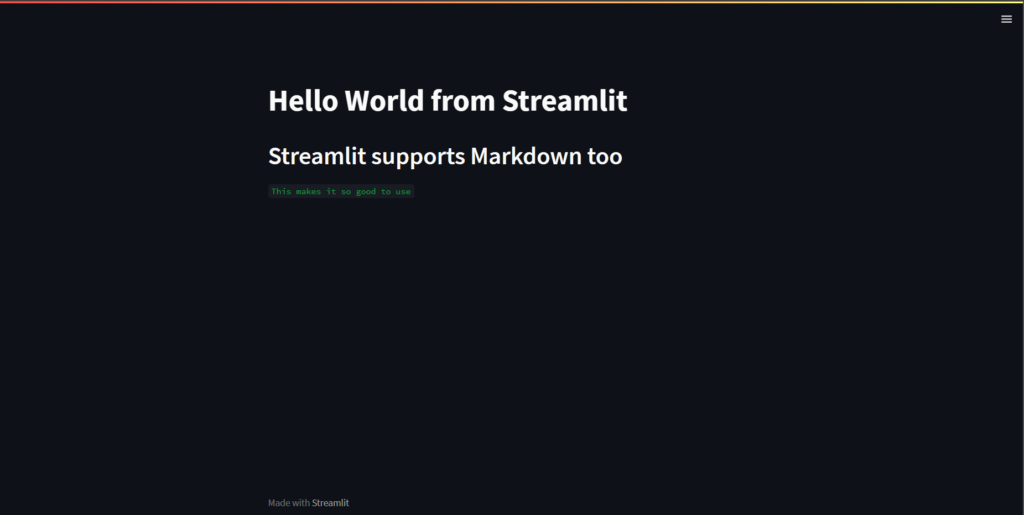
Congratulations on your very first streamlit app 👏.
Now let’s do more with our app.
For our case we are going to use this CSV file Agriculture Stats for Countries
@st.cache_data
def get_UN_data():
    AWS_BUCKET_URL = "https://streamlit-demo-data.s3-us-west-2.amazonaws.com"
    df = pd.read_csv(AWS_BUCKET_URL + "/agri.csv.gz")

    return df.set_index("Region")
Code language: Python (python)
Let’s break down our code
- @st.cache_data: In simple words it caches the data, if you were to call
get_UN_dataagain then it will not download the CSV again or do any of it again. It will simply pick from the cache and return it. This makes it fast.
Let’s see our data in all the chart format. To do that add the following code in your app.py file
Code language: Python (python)df = get_UN_data() st.line_chart(df) st.area_chart(df) st.bar_chart(df)
Keep in mind that we are just plotting the entire data on a chart as that is our goal here. Re run the code and check your browser. All the graphs are plotted with just 3 extra lines of code.
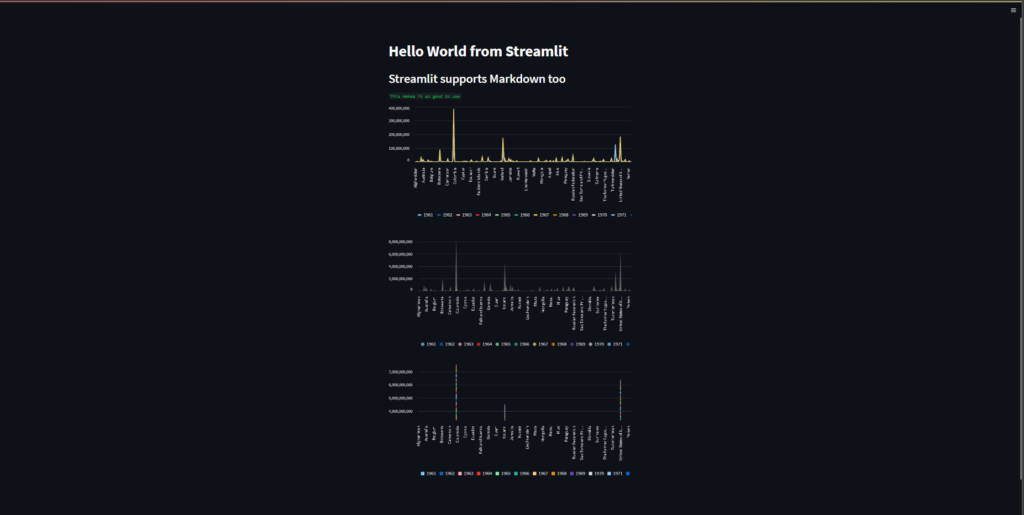
Voila that’s it.
Here is what more you can do with Streamlit in python
- Create apps to showcase your ML projects
- Create multipage apps
- Deploy your code for the world to see for free using streamlit
That’s it folks for this blog. For starting your python journey with us checkout Python Basics and do checkout Streamlit Documentation


